Abstract
Strauss-Howe generational theory claims that Anglo-American history moves through a cycle of about 85 years, made of four “turnings” of roughly 21 years each, driven by generations reacting to the world that raised them. Critics say the theory names no mechanism and cannot be tested. We write down the mechanism it implies as a cybernetic system, a balancing feedback loop with a delay of one generation, and use that model to turn the theory into claims that could be checked. The model can reproduce the theory’s shape, four phases of one delay each, but only because we put in the delay, the sign of the reaction and the way the cycle is cut into quarters. The shape is fragile: if the delay is spread across overlapping cohorts as real ones are, the self-sustaining cycle disappears, and modest changes to the model’s form move the period anywhere from 64 to 109 years. Ages of present-day legislators suggest a delay of 30 to 46 years, which would predict a cycle of roughly 100 to 185 years, and the best cohort study we found points to a reinforcing loop that would not cycle at all. Rough 85-year rhythms also appear in red noise with no loop in it. In the United Kingdom since 1900, the Strauss-Howe dates agree with our coding of events far better than chance, but a simple rule that follows major shocks agrees better still. We end with five predictions that would count against the generational loop if they failed, a note on how a widely read forecast becomes part of the system it describes, and what can and cannot be said about 2026.
1. Introduction
In 1997 William Strauss and Neil Howe wrote: “Around the year 2005, a sudden spark will catalyze a Crisis mood. Remnants of the old social order will disintegrate. Political and economic trust will implode.” The financial crash came in 2008. Since then The Fourth Turning has had a second life, and in 2023 Howe, writing alone after Strauss’s death in 2007, published The Fourth Turning Is Here. It dates the present crisis from 2008, and in an interview that July Howe put its climax “around the edge of and the end of the decade”, with a resolution expected in the early 2030s.
Most historians and social scientists have dismissed the theory. Peter Turchin, who models historical dynamics with data, calls it a prophecy, since it “simply postulates that there is a recurring cycle of four generation-length stages” in Anglo-American history. Francis Fukuyama, reviewing the 2023 book for the New York Times, wrote that “his periodization is very arbitrary.”
These criticisms share a point that cybernetics is well placed to address. A cycle in any system, a thermostat, a market or a population, needs a cause: some loop of influence that brings the system back on itself, and some delay in that loop. Strauss and Howe describe the output of such a loop in detail and the loop itself only in passing. Our aim is to draw the loop they imply, run it, and use it to say what evidence would support or count against the theory. A model like this cannot prove the theory right. What it can do is show which assumptions the 85-year cycle rests on, and which of them can be measured.
2. The theory as stated
The model was set out in Generations (1991) and The Fourth Turning (1997). Its main parts are these.
- The saeculum, a cycle about the length of a long human life, around 80 to 100 years.
- Four turnings within each saeculum. In a High, institutions are strong and individualism weak. In an Awakening, institutions are attacked in the name of personal and spiritual autonomy. In an Unraveling, institutions are weak and distrusted while individualism flourishes. In a Crisis, institutional life is destroyed and rebuilt in response to a perceived threat to the nation’s survival.
- Four generational archetypes (Prophet, Nomad, Hero, Artist), each formed by the turning in which it grows up. In Howe’s current mapping, Boomers are Prophets, Generation X Nomads, Millennials (born 1982 to 2005) Heroes and the Homeland generation (born from 2006, roughly the younger part of what others call Generation Z) Artists.
- A mechanism: generational change drives the cycle and sets its length. Every 20 years or so, each living generation moves into a new phase of life (childhood, young adulthood, midlife, old age), and the social mood shifts with it.
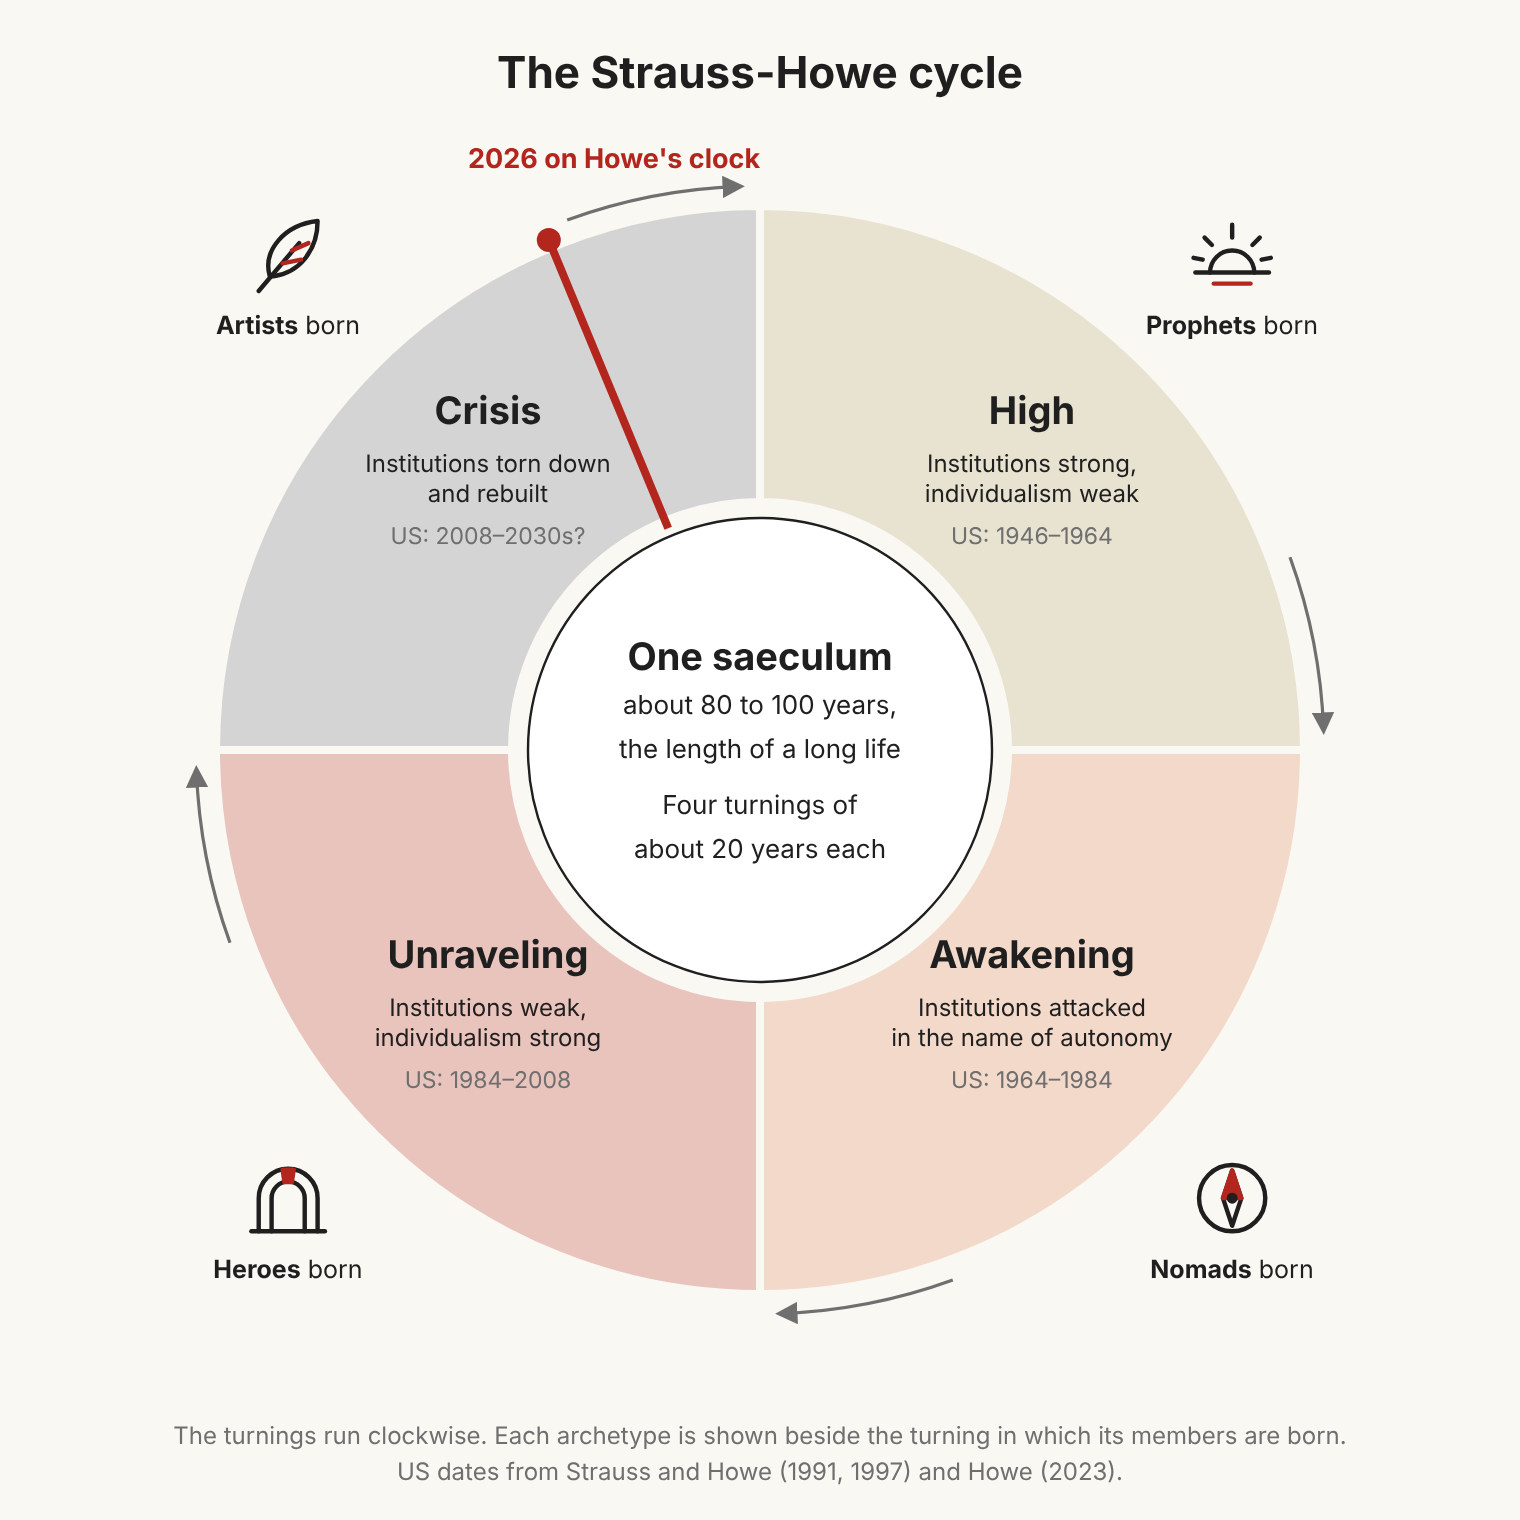
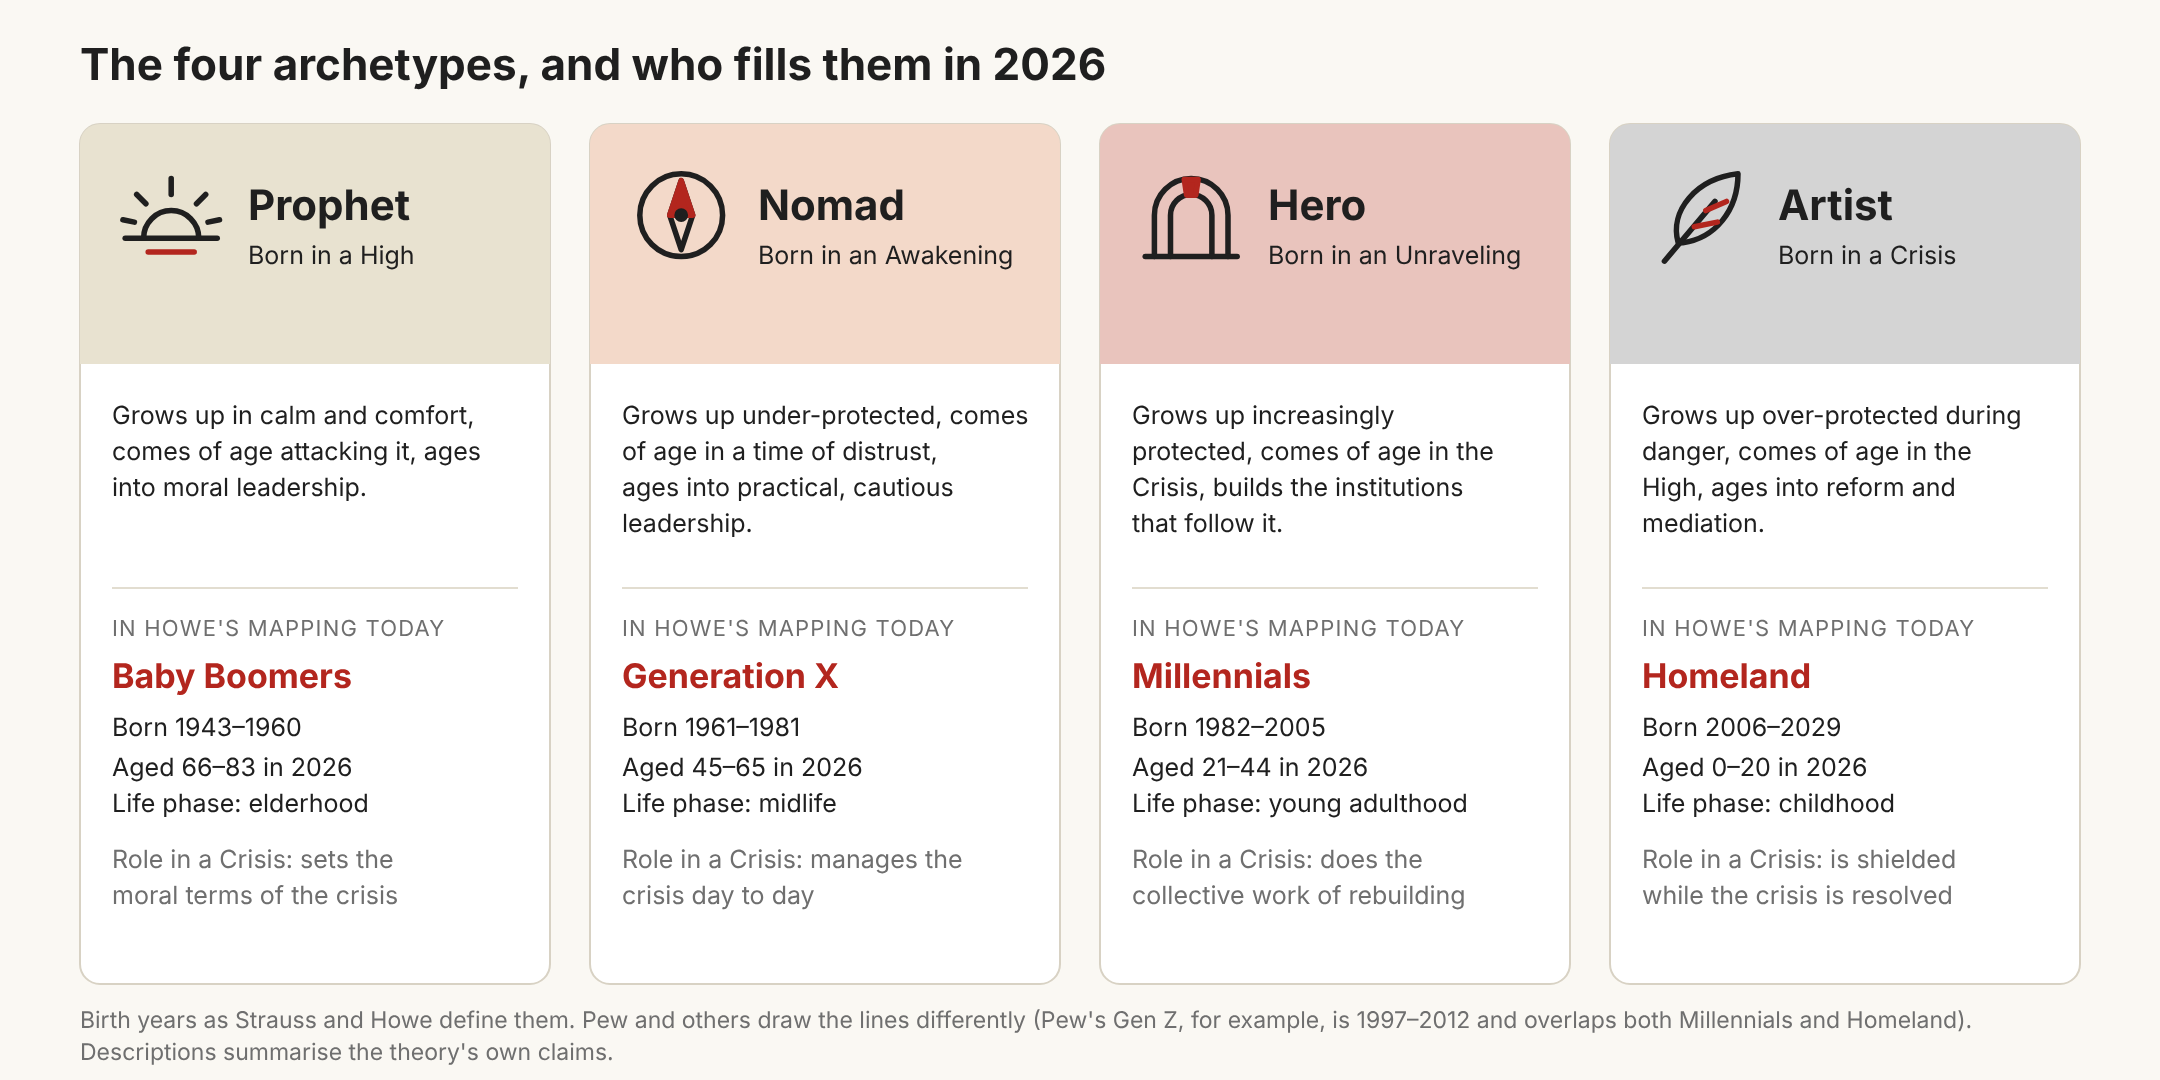
The authors trace seven saecula back to 1435. The last American Crisis ran from the 1929 crash to the end of the Second World War; the High that followed began in 1946.
3. Reading the theory as a feedback system
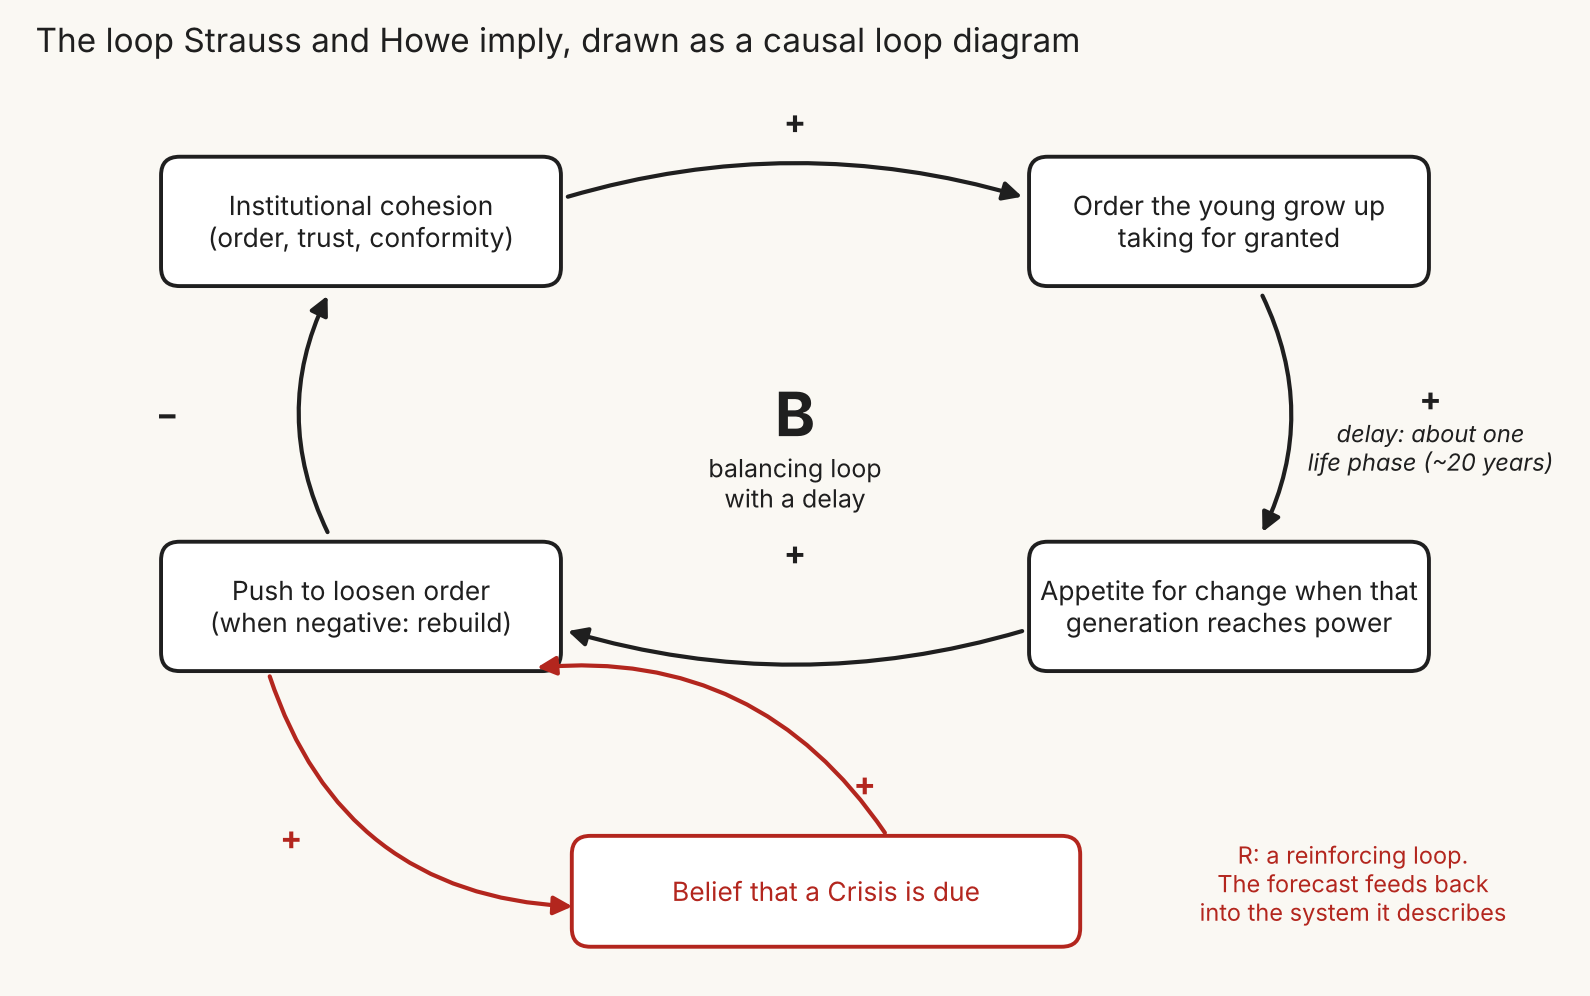
Strip away the archetypes and the theory makes a claim about feedback. The amount of order a society has shapes what its children take for granted. When those children reach the age of influence, they push against whatever their upbringing over-supplied: a generation raised in strong order seeks autonomy, and a generation raised in disorder seeks to rebuild. That push changes the amount of order, which shapes the next set of children.
Figure 3 draws this as a causal loop diagram, the notation used in system dynamics, the field Jay Forrester founded at MIT. The loop has one negative link, so it is a balancing loop: it pushes the system back towards the middle. On its own a balancing loop settles, as a thermostat does. The theory’s cycle depends on the other element in the diagram: the delay between a generation being formed and that generation acting.
This combination was among the first things cybernetics studied. In 1943 Arturo Rosenblueth, Norbert Wiener and Julian Bigelow described how a feedback system that reacts too strongly, or too late, overshoots its goal and oscillates. Wiener’s Cybernetics (1948) linked it to the “purpose tremor” of patients whose hand overshoots the object it is reaching for. A generational cycle, if one exists, would be a purpose tremor at the scale of a whole society.
We are far from the first to read American politics this way. Arthur Schlesinger Sr and Jr described a cycle between public purpose and private interest in which most phase pairs run about 30 years, “roughly the length of a human generation”. Frank Klingberg found American foreign policy alternating between introversion and extroversion, with full cycles of about 47 to 50 years. Samuel Merrill, Bernard Grofman and Thomas Brunell (2008) went furthest: they wrote an explicit negative-feedback model of voters and parties and tested it with spectral analysis of US election data from 1854 to 2006. They found cycles of roughly 25 to 30 years. So a balancing loop in politics is an old idea, and the most direct test of it on American data that we know of found a period about a third of the saeculum. Our contribution is narrower: writing the Strauss-Howe version down makes its hidden assumptions visible.
4. A minimal model
We write the loop in the simplest form we could find. Let x be institutional cohesion measured as a deviation from its long-run average, so positive means more order and trust than usual and negative means less. The rate at which cohesion changes today depends on the state of the society in which today’s adults were formed, one delay τ ago:
dx/dt = −k · tanh( x(t − τ) )
The minus sign is the balancing link: high cohesion in the past produces pressure to loosen it now. The constant k is the strength of the reaction. The tanh function caps the reaction so that it cannot grow without limit, since there is only so much a generation can tear down or build in a given year. The model has two parameters and no built-in cycle. Any oscillation has to come from the loop.
We ran the model numerically with a time step of 0.05 years. The code is short and is published with this essay (see Data and code).
4.1 The model in plain terms
Readers who are happy with the equation can skip this section. For everyone else, here is what it does, step by step.
One number. The model describes a whole society with one number, x: how much more or less order and trust it has than usual. Positive means more than usual, zero means average, negative means less.
One rule. The equation says that how fast cohesion changes this year depends on how far from average it was 21 years ago, and pushes the opposite way. Each symbol has a plain meaning:
- dx/dt is the change per year: whether cohesion is going up or down, and how quickly.
- x(t − τ) is the value one delay ago. With τ = 21 years, today’s adults are reacting to the world they grew up in.
- The minus sign is the reaction. Too much order in the past brings a push to loosen it now; too little brings a push to rebuild.
- k is how strong that reaction is.
- tanh is a cap. For small values it leaves the number almost unchanged, and for large ones it flattens out, so no generation can push without limit.
How the computer runs it. The computer moves forward in small steps of 0.05 years. At each step it looks up the value from 21 years earlier and applies one line of arithmetic: new x = old x + 0.05 × (−k × tanh(x from 21 years ago)). Repeated a few thousand times, that is the whole model.
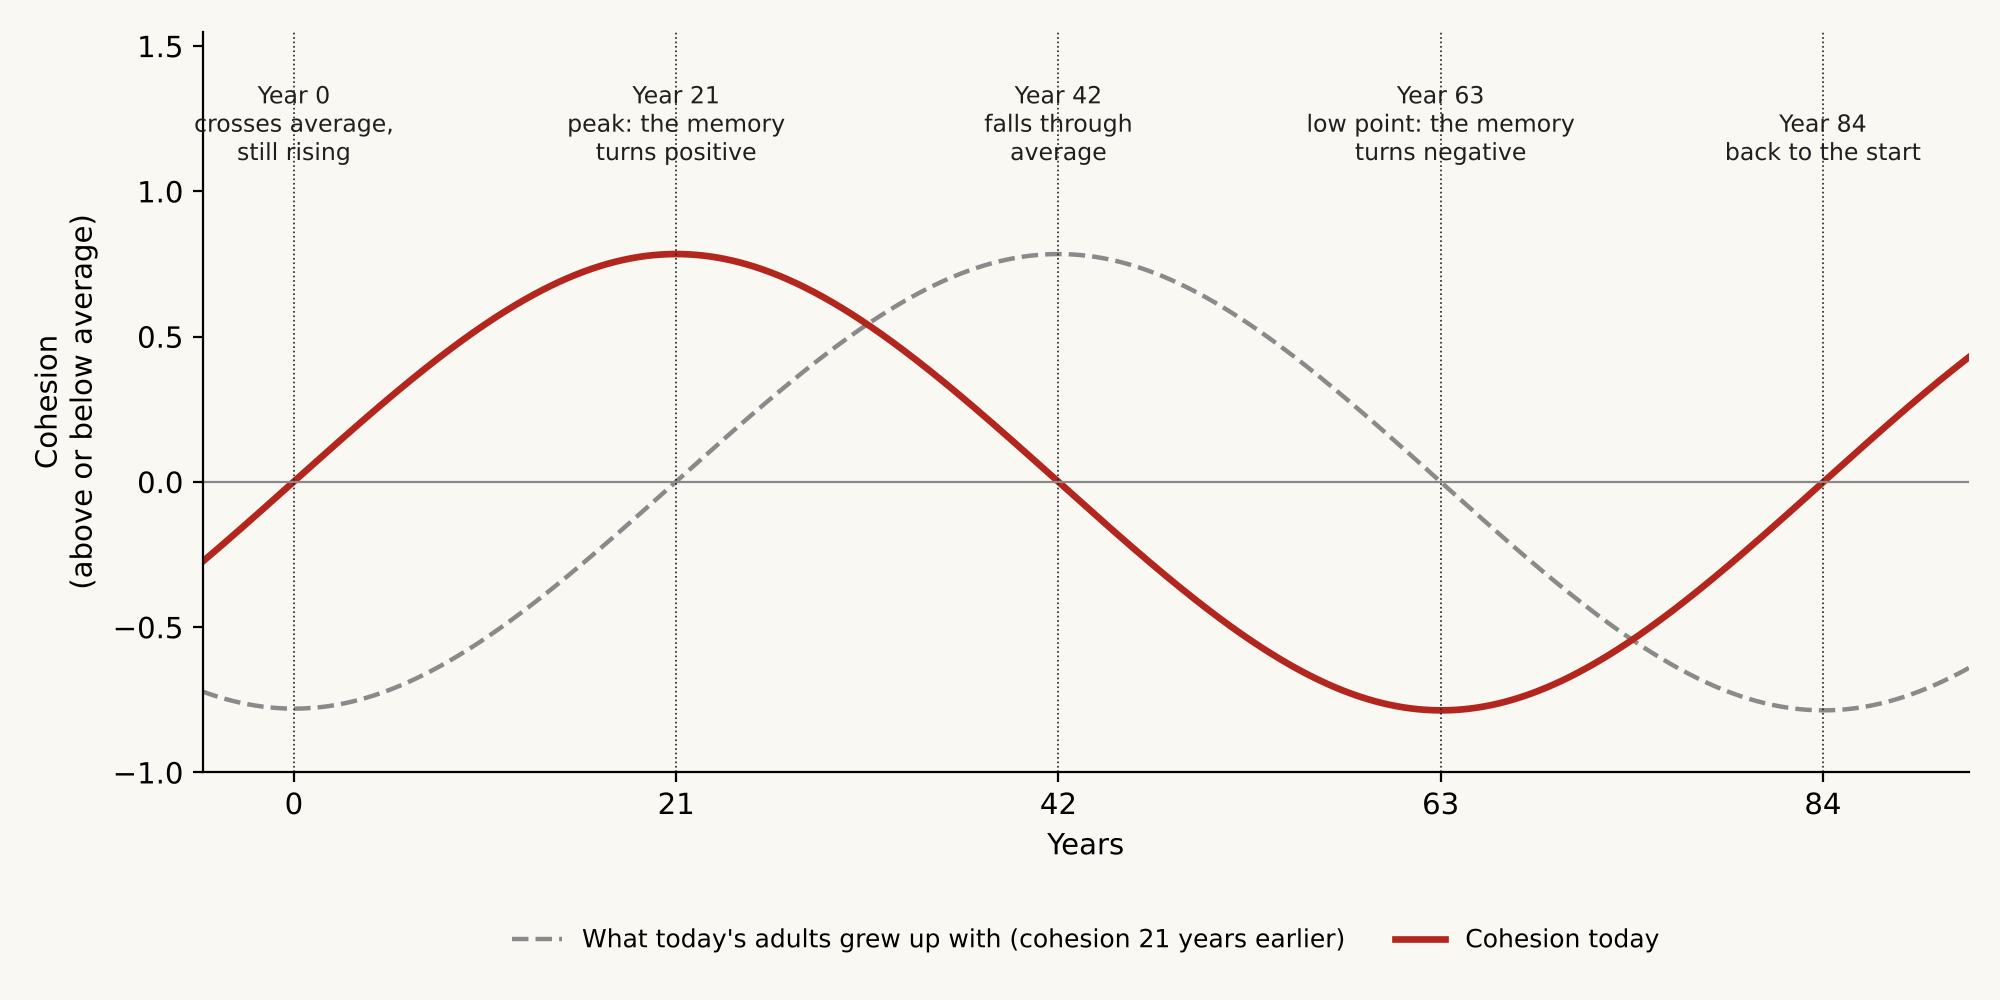
Why it goes round. A shower with a long pipe is a good comparison. You feel cold, turn up the heat, still feel cold, turn it up more, and by the time the hot water arrives you have overdone it. The delay makes you overshoot. Figure 4 shows the same thing in the model. The red line is cohesion today; the dashed line is what today’s adults grew up with, the same curve shifted 21 years to the right.
- Year 0: cohesion crosses the average on the way up. The adults in charge grew up in the low years (the dashed line is below zero), so they keep building.
- Year 21: the dashed line crosses zero. Adults now grew up with above-average cohesion, the push turns to loosening, and cohesion peaks.
- Year 42: cohesion falls back through the average.
- Year 63: the dashed line goes below zero again, adults start rebuilding, and cohesion reaches its low point.
- Year 84: back where it started.
Each quarter lasts one delay, so a full cycle takes four delays: 4 × 21 = 84 years.
Why it keeps going. Whether the cycle lasts depends on how strong the reaction is compared with the delay, the number kτ. If it is weak (below about 0.37), cohesion drifts back to average without overshooting. In the middle range (up to about 1.57, or π/2) it overshoots, but each swing is smaller than the last, like a pendulum slowing down. Above that, each swing would be bigger than the last, until the cap holds it steady at a regular cycle. Our main run uses 1.8.
Adding the real world. In section 5.6 we add a small random kick at every step, standing in for wars, crashes and inventions, and set the reaction in the middle range so that the loop would settle on its own. The kicks keep restarting it, and the loop turns them into rough waves that average about 84 years but never keep to a timetable.
What the maths does not decide. Three things in this model are chosen by us, and each one settles part of the answer. The 21-year delay sets the cycle length. The minus sign decides that there is a cycle at all. And the names of the four turnings are labels we attach to quarters of a wave. Section 5 takes each of these in turn and asks what happens when it is changed or measured.
5. What the model can and cannot show
5.1 A consistency check: four turnings of one delay each
With a delay of 21 years, one Strauss-Howe life phase, and a reaction strong enough to keep the loop going (kτ = 1.8), the model settles into a steady cycle of 84 years (Figure 5).
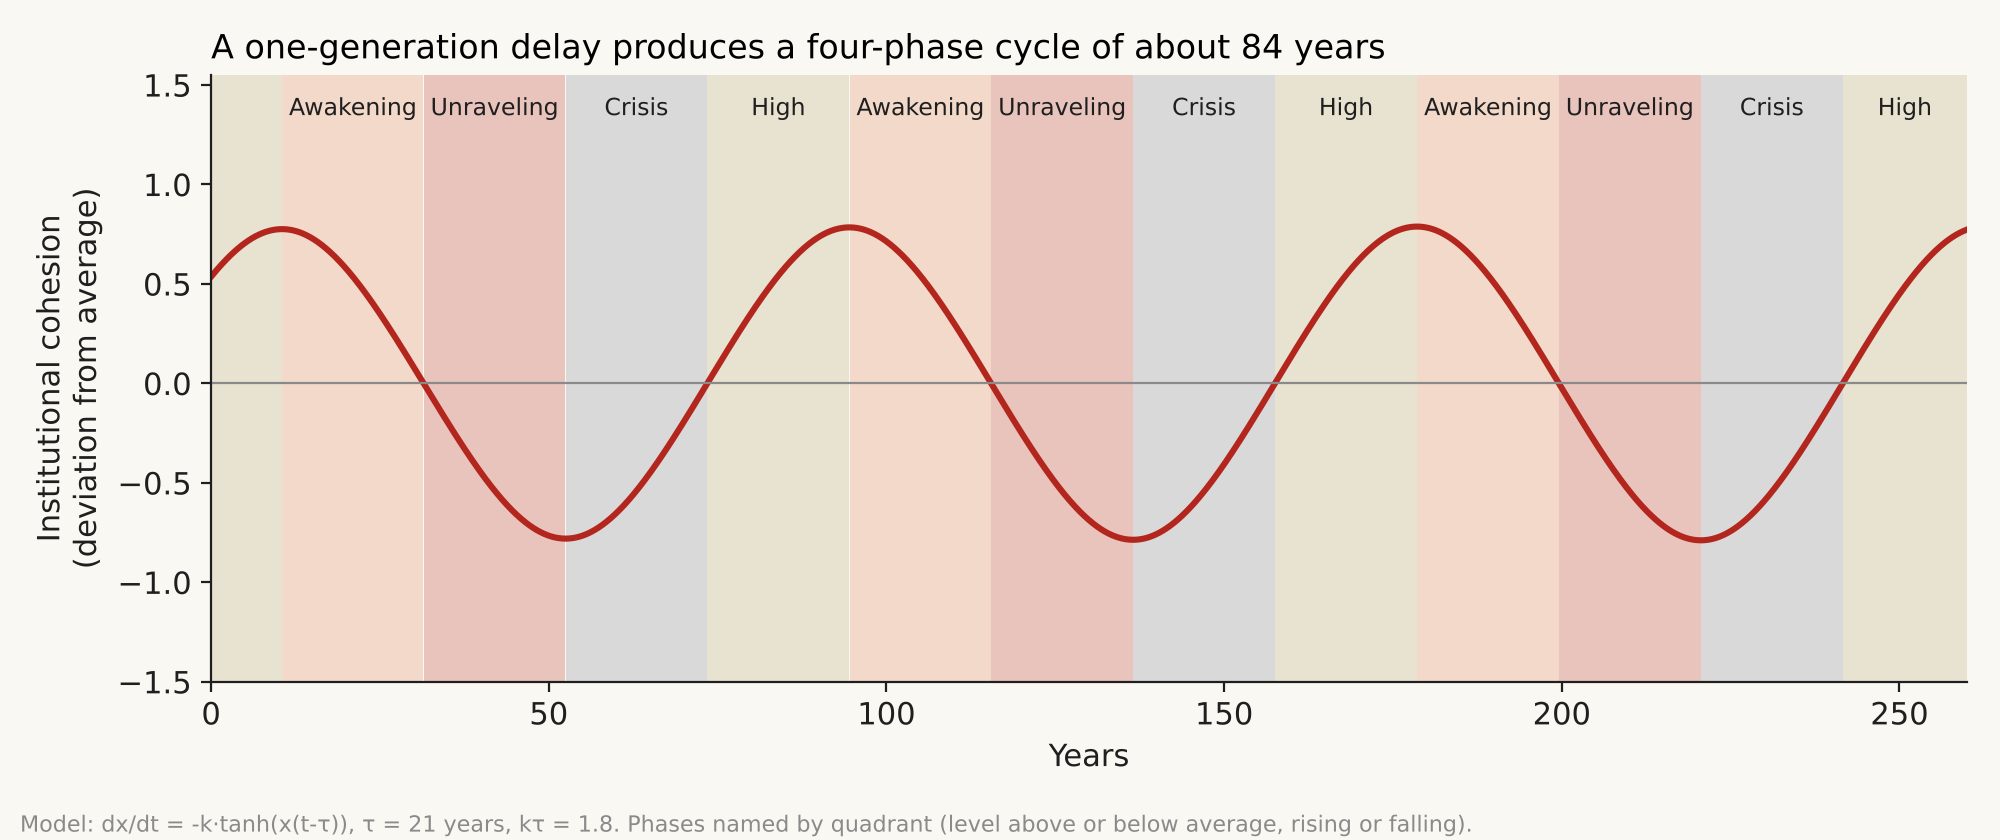
This should be read as a check that the theory hangs together, and nothing more. Each part of the outcome was put in. The delay of 21 years comes from the theory. The period of four delays is a known property of this family of equations: for any odd, capped reaction above the threshold kτ = π/2, the steady cycle lasts 4τ (Kaplan and Yorke, 1974). The four phases come from us cutting the wave into quadrants by level and direction (high and rising, high and falling, low and falling, low and recovering) and matching them to the theory’s High, Awakening, Unraveling and Crisis. Shifting the labels by half a quarter would be just as defensible, since Strauss and Howe’s Crisis includes the destruction of old institutions as well as their rebuilding.
What the check does establish is that the theory’s shape is possible: a delayed balancing loop can produce four phases of one generation each. It also exposes a detail the theory does not mention. In this model the two quarters that begin when cohesion crosses its average, High and Unraveling, always last exactly one delay, because the turning point comes one delay after each crossing. When the loop is damped, all the extra length goes into the other two: at kτ = 1.2, for example, the quarters run 21, 25, 21 and 25 years, with Awakening and Crisis the longer pair. We use this as a test in section 7.
5.2 The cycle length comes from the delay, and the form of the loop
Figure 6 shows what happens as we vary the delay. The cycle length follows it almost exactly, at about four times the delay. With a strong reaction the ratio stays close to 4. With a weaker reaction the loop is damped and runs a little slower.
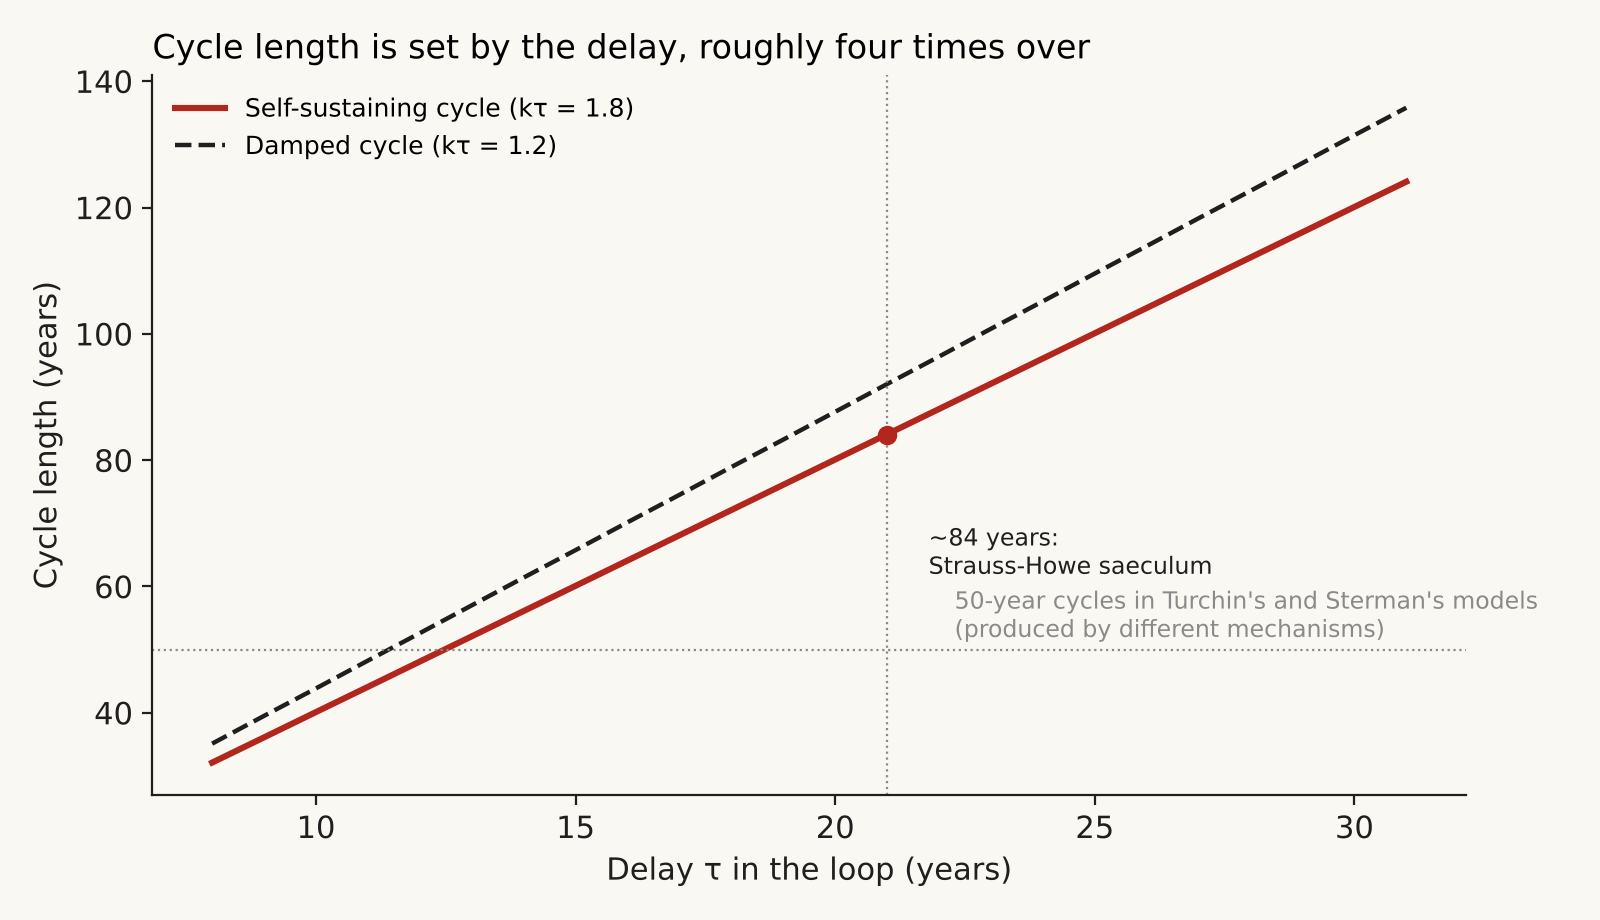
The 85-year saeculum therefore follows from a 21-year delay, and the 21-year phase is a premise of the theory that nobody has measured. The period also depends on details of the loop’s form that the theory never specifies. In runs from a deliberately hostile review of the model, keeping τ = 21 but letting institutions decay slowly on their own (a half-life of 14 to 70 years) shortened the cycle to between 64 and 78 years. A small self-reinforcing term lengthened it to 109 years. Making rebuilding twice as strong as loosening stretched the cycle only to 89 years but made the turnings very unequal, with Awakenings of about 32 years and Crises of 14. Within plausible versions of the same loop, the period is somewhere between about 64 and 109 years before the delay itself is questioned.
Turchin built a different generational model in which people enter political life at 20 and leave at 55, radicals recruit the young, and high levels of radicalisation, “by breeding moderates, create a backlash against violence and yearning for peace”. It produces peaks of political violence roughly every 50 years, and Turchin writes that getting a four-generation cycle out of it would require “truly ‘heroic’ assumptions.” A 50-year rhythm also comes out of system dynamics, from a different mechanism. Forrester’s National Model generated the Kondratiev long wave “without any external driving time series”, and John Sterman traced it to capital-producing industries ordering capital from each other: “Self-ordering is therefore a sufficient cause of long waves”, with a period of “approximately 50 years”. Neither model was built to test Strauss and Howe. Their relevance is that when a long cycle is generated from an explicit loop, the period follows from the loop’s structure and delays, which have to be measured.
5.3 Overlapping cohorts weaken the cycle
The model above uses one sharp delay, as if every adult in charge had been formed exactly 21 years ago. Real power is spread across people formed over several decades. A more realistic version replaces the single delay with a spread of delays that averages 21 years (a gamma distribution, which spreads the delay smoothly around its mean). Figure 7 shows what the spread does.
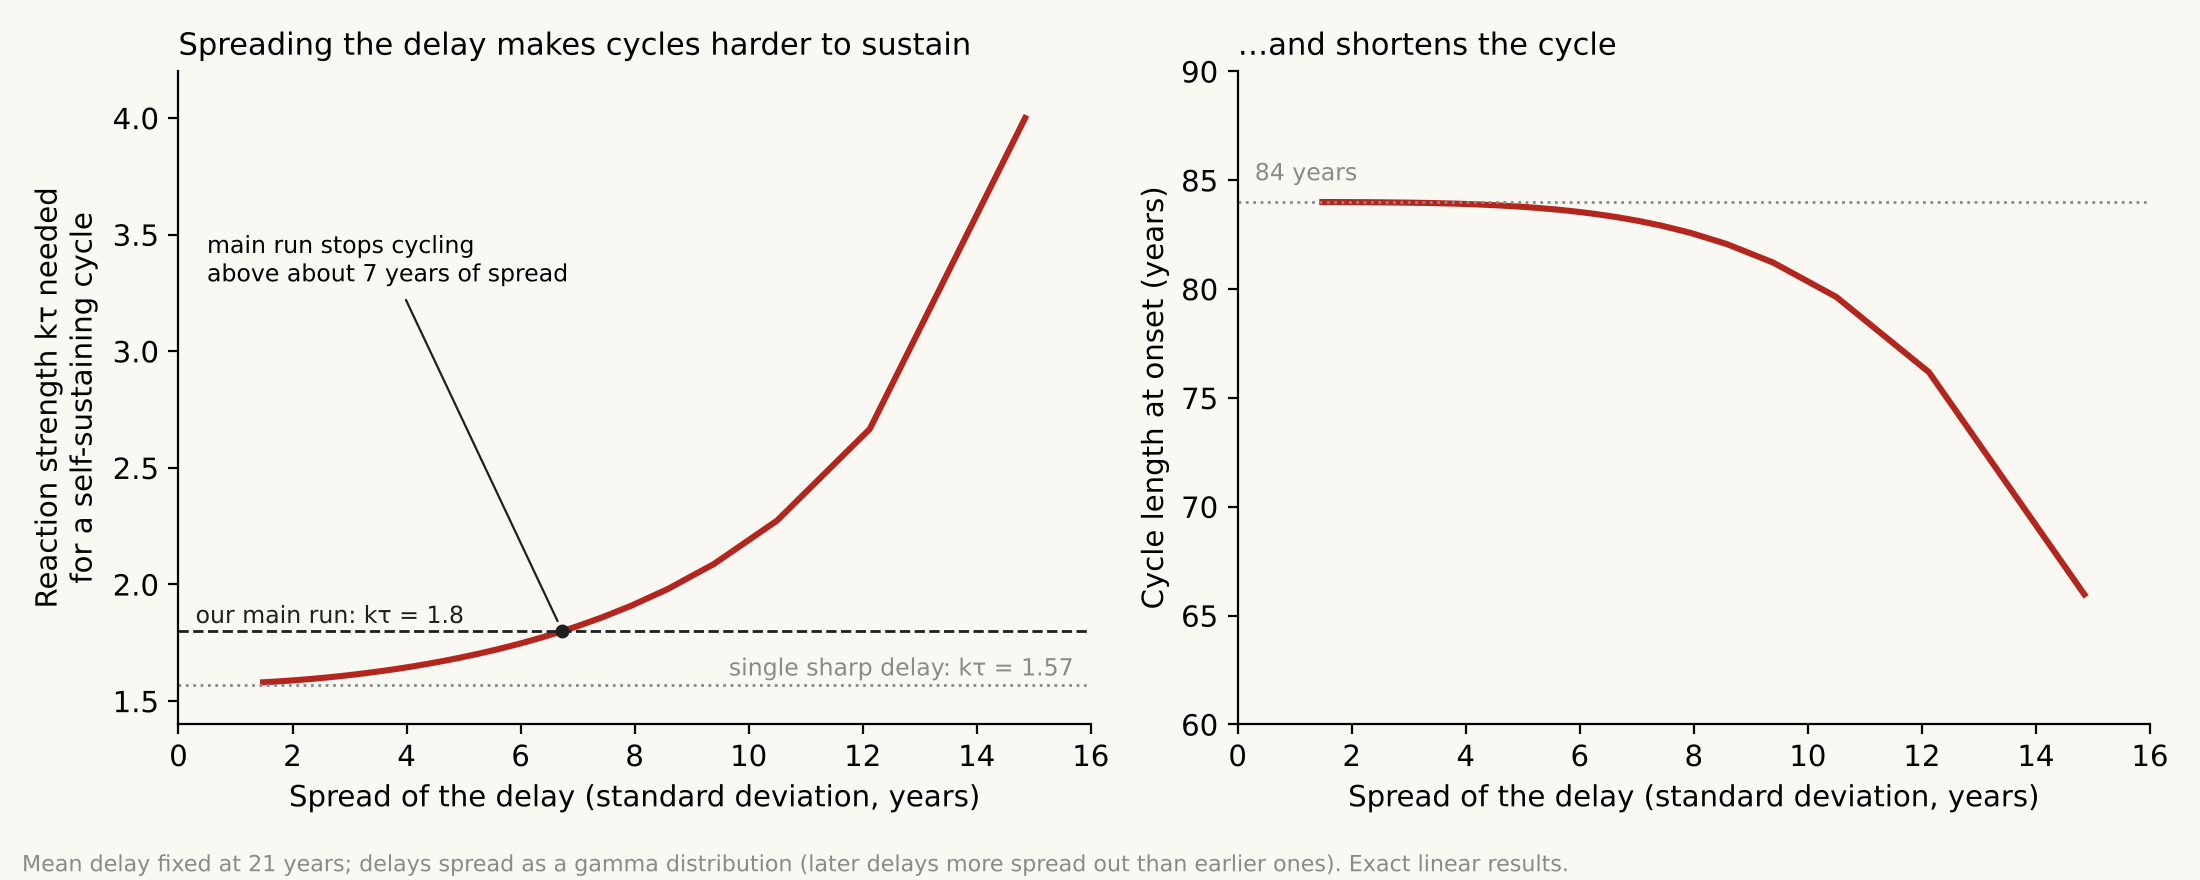
Two things change. The loop needs a much stronger reaction to keep cycling: the threshold kτ rises from 1.57 with a single sharp delay to 1.86 with a spread of 7 years, 2.27 with 10.5 years, and 4.0 with about 15 years. Our main run (kτ = 1.8) stops sustaining itself once the spread passes about 7 years, and settles to a damped wave. At the same time the period at the threshold shortens, from 84 years to 80 with a 10.5-year spread and 66 with a 15-year spread. A spread of 7 years means two in three of the people whose upbringing matters were formed within about seven years of the average. The adults who run a country span 40 or 50 years of age, so the realistic case is a wide spread, and in that case the cycle is damped and shorter than the saeculum. A self-sustaining 85-year cycle needs power to sit in a narrow age band. If a damped loop is the realistic case, any rhythm comes from shocks restarting it, which section 5.6 examines.
5.4 Measuring the delay
The delay in this model is the gap between the age at which people’s views are formed and the average age of the people whose views drive change. Both can be estimated. Work on political socialisation places the formative years in adolescence and early adulthood: Ghitza, Gelman and Auerbach find that the weight of political events on later voting peaks between about 14 and 24, with a maximum around 18. Table 1 subtracts 18 from the average age of three legislatures.
Table 1. Delays implied by the ages of legislators
| Who drives change | Average age | Source | Delay τ (age − 18) | Implied cycle (3.2τ to 4τ) |
|---|---|---|---|---|
| UK MPs, 2024 Parliament | 48 | PoliticsHome, The House, 2024 | about 30 | about 96–120 years |
| US House, 119th Congress | 57.9 | Congressional Research Service, R48535 | about 40 | about 128–160 years |
| US Senate, 119th Congress | 63.9 | Congressional Research Service, R48535 | about 46 | about 147–184 years |
The lower end of each range, 3.2τ, applies when the delay is spread with a long tail, which shortens the cycle as section 5.3 showed. On these figures the model predicts a cycle of roughly 100 to 185 years, and an 85-year saeculum would count as a failed prediction. To get a delay of 21 years we would have to assume that the typical person driving change is about 40, younger than the average MP and much younger than most heads of government. Legislators are a crude proxy: voters, officials, editors and activists also matter, and a careful estimate would weight them all. Doing that for each Parliament since 1900 is the single most useful next step, because it turns the theory’s central number from an assumption into a measurement.
5.5 Which way does the loop push?
The minus sign in the model, a generation reacting against its upbringing, carries the whole theory. With a plus sign, the same delayed loop would reinforce: each generation would carry forward what it absorbed, and society would drift or lock in without cycling.
The evidence on the sign is mixed, and the strongest quantitative study we found points the wrong way for Strauss and Howe. Ghitza, Gelman and Auerbach model US presidential votes as shaped by the popularity of presidents across a voter’s life. Cohorts formed under popular Republican presidents, such as the “Eisenhower Republicans” and “Reagan Conservatives”, stay more Republican for life, a same-direction imprint. Ronald Inglehart’s work on values offers both signs at once: his scarcity hypothesis says people prize what was scarce in their youth, a reaction, while his socialisation hypothesis says values set in early adulthood persist, which gives drift through generational replacement. Neither study measures institutional trust in the way the model needs. The sign is the theory’s central empirical claim, and it is open.
5.6 Rough cycles from noise, and from no loop at all
A society is never a clean loop. Wars, pandemics, inventions and harvests hit it at random. Figure 8 shows the model with a weaker reaction (kτ = 1.4), below the level at which it would oscillate on its own, pushed by small random shocks.
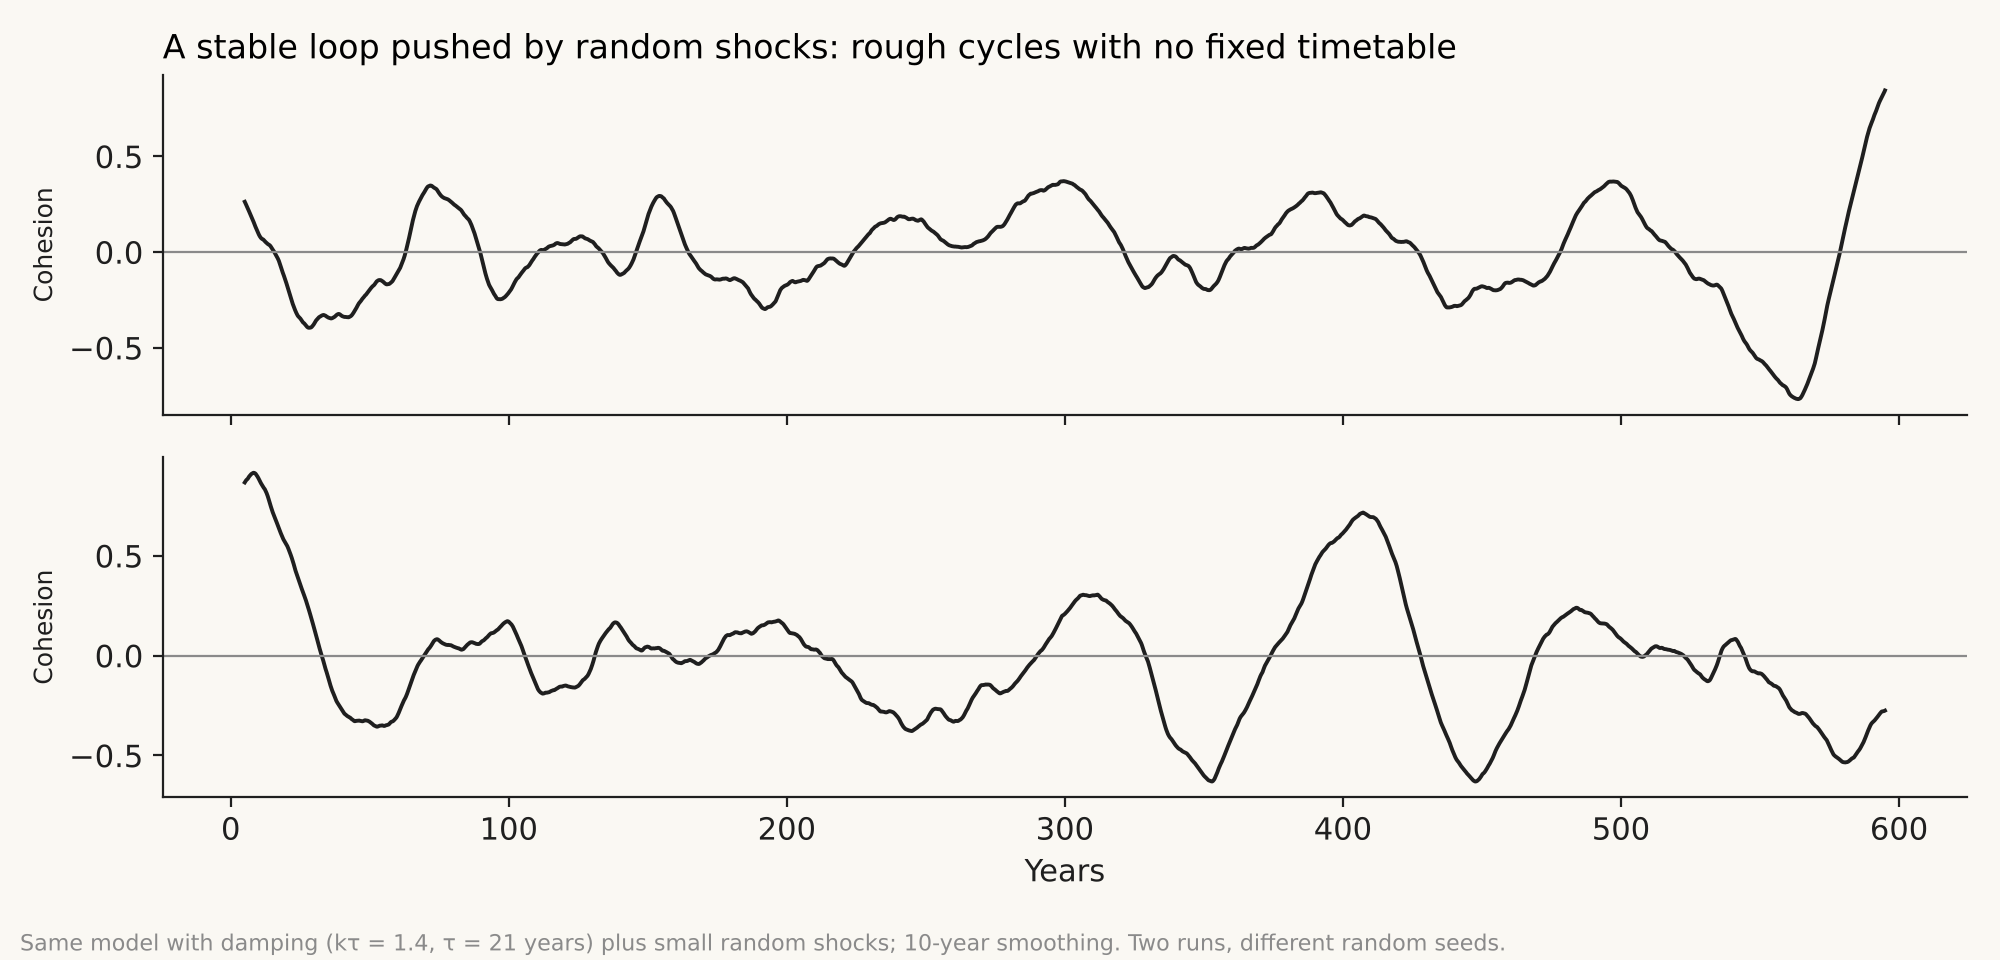
The result has long swings, some sharp, some shallow, none on schedule. Over 20,000 simulated years, with the series smoothed over ten years and brief wobbles under 15 years ignored, the gap from one upswing to the next had a median of 86 years, with one gap in ten shorter than 48 years and one in ten longer than 111.
That number says less than it seems to. In 1927 Eugen Slutsky and George Udny Yule showed that smoothed random series produce convincing cycles, and the same thing happens here. Table 2 applies our procedure to the same simulated series with different smoothing, and to random series with no delayed loop in them at all.
Table 2. Median gap between upswings under the same counting procedure
| Series | Smoothing | Median gap (years) |
|---|---|---|
| Noisy delayed loop, kτ = 1.4 | none | 42 |
| Noisy delayed loop, kτ = 1.4 | 2 years | 74 |
| Noisy delayed loop, kτ = 1.4 | 5 years | 82 |
| Noisy delayed loop, kτ = 1.4 | 10 years | 86 |
| Noisy delayed loop, kτ = 1.4 | 20 years | 89 |
| Red noise, no loop, 40-year memory | 10 years | 70 |
| Delayed loop too weak to overshoot (kτ = 0.35) | 10 years | 97 |
Two things follow. The median gap depends heavily on how the analyst smooths the data. And a rough rhythm in the range of 70 to 100 years appears in series with no oscillating mechanism at all, as long as they have a long memory and the data are smoothed by about a decade. Finding an 85-year rhythm in history is therefore weak evidence for a generational loop.
A sharper test would compare a self-sustaining cycle with a damped loop driven by shocks. The first should show regular gaps and a narrow peak in a spectrum of long-run data; the second, irregular gaps and a broad hump. One society offers about seven saecula since 1435, which is too few. In simulated runs of that length, the regularity of the gaps tells the two cases apart only 60% of the time, against 50% for a coin toss. Strauss and Howe’s own gaps between the starts of successive Highs (107, 110, 90, 71 and 81 years) fit either case. To our knowledge nobody has run this test on Strauss-Howe turnings with independently measured data from many countries, which is Turchin’s wider complaint about cyclical history: such theories “are not subjected to empirical tests with independently gathered data.”
6. A case study: the United Kingdom since 1900
A model shows what a loop could do. To see what history did, we took one society and marked its stages from the evidence. We chose the United Kingdom from 1900 to now for a specific reason. Strauss and Howe built their cycle on English history up to 1776 and on American history after it, so modern Britain is a society the theory was never fitted to. Howe also argues that the cycle is now shared across many countries, which gives the UK a clear prediction to meet.
6.1 Method
We wrote the rules first and revised them once while marking the dates. Each stage is defined by indicators that can be checked:
- Crisis: an existential threat or breakdown (total war, national emergency, emergency powers), a coalition or national government, and new institutions built in response. Constitutional upheaval, such as referendums that change the state’s borders or treaties, counts as a supporting marker; we added this during coding.
- High: no emergency, the two largest parties taking 85% or more of the vote, low strike activity, and new institutions consolidated with agreement across parties.
- Awakening: the party system still holding, with rising conflict, organised movements challenging authority, and liberalising laws.
- Unraveling: no emergency, the party system fragmenting or turnout falling, trust falling, and market or individual choice replacing collective provision.
The indicators are the vote share of the two largest parties (for 1931 and 1935, the National Government bloc; the Conservatives alone still took over 85%) and turnout at every general election since 1900, working days lost to strikes (the full annual ONS series from 1891), survey measures of trust where they exist, and a dated list of events. The full protocol and data are published with this essay (see Data and code). One weakness should be stated plainly: we knew the Strauss-Howe dates while coding, and that may have pulled our boundaries towards theirs. A cleaner version would use several coders who had not seen them.
6.2 Results
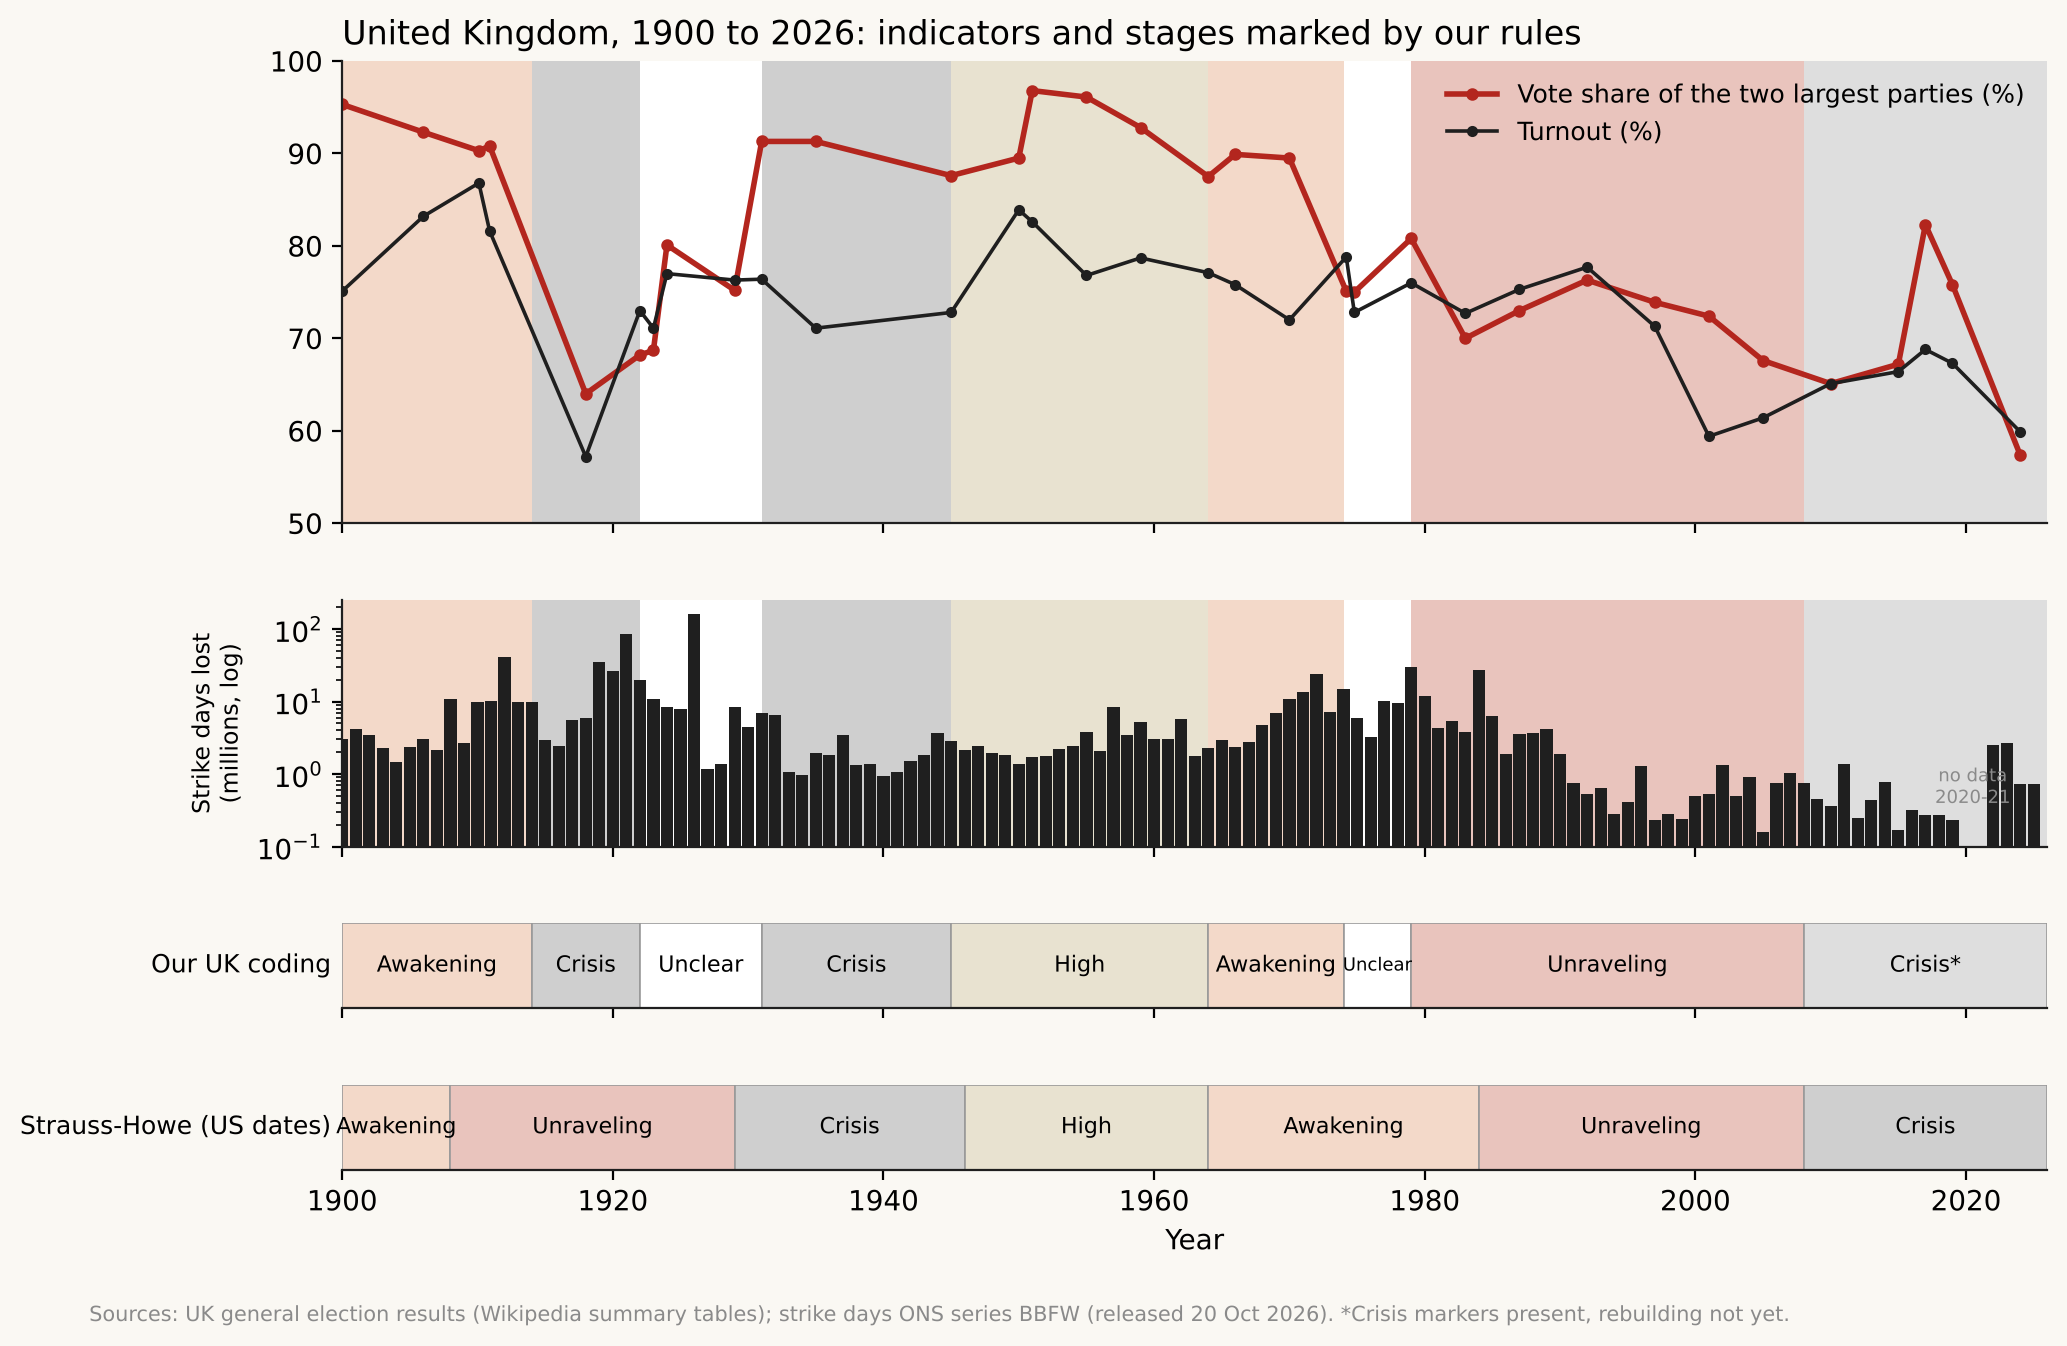
From 1929 onwards the two timelines agree broadly, with offsets of up to ten years. Britain’s crisis markers run from the 1931 financial crisis and National Government through the Second World War to 1945, against Strauss and Howe’s 1929 to 1946. A High follows to 1964, with the two main parties taking 93 to 97% of the vote at the three elections from 1951 to 1959 and the welfare state built and kept by both. The 1960s bring liberalising laws and protest, but Britain’s Awakening gives way around 1974, ten years before the American date, and the years from 1974 to 1979 fit no stage cleanly. From 1979, privatisation, falling turnout and a fragmenting vote fit an Unraveling, starting five years before the American date of 1984. From 2008 the Crisis markers are partial. The crash and the bank rescues were an emergency, and the coalition of 2010 was the first since 1945, though it came from a hung parliament during the fiscal crisis that followed, which is weaker than the wartime and 1931 cases. The referendums of 2014 and 2016 and the Covid emergency powers add to the markers. The rebuilding of institutions has not started.
The strike record, from the Office for National Statistics series going back to 1891, follows the post-war stages. Days lost stay fairly low through the High, mostly between 1.4 and 5.8 million a year, with one spike of 8.4 million in 1957. They climb through the Awakening, from 2.3 million in 1964 to 23.9 million in 1972, and peak at 29.5 million in 1979 and 27.1 million in the 1984 miners’ strike. After that they collapse: from 1991 onwards they rarely pass one million a year. The 2.5 and 2.7 million lost in 2022 and 2023 were the highest since 1989.
Before 1929 the two timelines disagree. Strauss and Howe place 1908 to 1929 in an Unraveling. For Britain those years hold a total war with a coalition government and conscription, the largest strike waves in the country’s history (40.9 million days lost in 1912, 35.0 million in 1919, 85.9 million in 1921, 162 million in 1926), the Emergency Powers Act of 1920, the loss of most of Ireland, and a General Strike. By our rules the war years and their immediate aftermath, under Lloyd George’s coalition to 1922, were a crisis. The years from 1922 to 1931 fit no stage cleanly: single-party governments faced the General Strike of 1926 under emergency powers. Speaking about Anglo-American history in 2023, Howe said that “every total war has occurred in a Fourth Turning”. The First World War was a total war for Britain and falls outside his Fourth Turning.
6.3 Three tests of the agreement
To put numbers on “broadly”, we coded each year from 1900 to 2025 and counted the share of years in which our stage matches the Strauss-Howe stage. The hostile review then ran three comparisons (Table 3).
Table 3. How well different timelines match our UK coding, 1900–2025
| Timeline | Share of years that match |
|---|---|
| Strauss-Howe dates | 0.73 (0.87 after 1929, 0.28 before) |
| Random timelines with Strauss-Howe-like turning lengths (average of 20,000) | 0.22 |
| Strauss-Howe dates shifted 5 years earlier or later | 0.59 to 0.62 |
| A “follow the shocks” rule with no generational clock | 0.87 |
The first comparison shows the agreement is real: random timelines with turnings of similar length almost never match as well (fewer than one in a thousand did). The second shows it is fairly sharp, since moving the American dates by five years loses much of it. The third is the one that matters. The “follow the shocks” rule marks a Crisis in years of war or national emergency, then assumes a High of 19 years, an Awakening of 10 and an Unraveling until the next shock. It has no generational mechanism, and it matches our coding better than Strauss and Howe do. The lengths in that rule were chosen by eye and are generous to it, so the comparison is rough. Even so, the UK record gives no reason to prefer a generational clock over the simpler reading that Britain’s stages follow its shocks.
The indicators themselves also separate the stages less than our rules suggest. Nine general elections with a two-party share of 85% or more fall outside the years we coded as High, including 1900, 1906, both 1910 elections and 1964 to 1970. High and Awakening years have almost the same range of two-party share, and the median number of strike days in years we coded as Crisis is lower than in High years. In practice the coding is carried by the list of dated events, which is the input that most depends on judgement.
6.4 What the case study tells us
The agreement after 1929 is weak evidence for a generational loop. The Depression, the Second World War, the cultural changes of the 1960s and the 2008 crash hit Britain and America at the same time, and shared shocks would line up the two countries’ stages whether or not a generational clock exists. The years before 1929 tell us more, because there the two countries took the same war at very different intensities, and Britain’s stages followed its own experience. The record counts against a single clock shared across countries, and against the claim that total wars only come in Fourth Turnings.
The UK record fits the noisy loop of section 5.6 at least as well as a fixed cycle. Large external events set off the turns, and slower generational and institutional feedback may shape what follows: the long consensus after 1945, the slow fragmentation after 1979. Britain’s crisis era also lasted about three decades, from 1914 to 1945 with an unclear stretch in the 1920s, well over the 20 or so years one turning is meant to take. With about six turning boundaries in 126 years, one country cannot settle the matter.
7. Five predictions that could fail
If the generational loop is real, it makes claims that could turn out false. These are the ones we think could be checked with existing data.
- The delay sets the period. Measure the delay from the ages of the people who hold influence, weighted by a formative-years curve, and predict the cycle length from it before looking at the dates of the turnings. If the predicted period is far from the observed one, the loop as written is wrong. Table 1 suggests this prediction already fails for the saeculum unless influence sits with people around 40.
- The sign is negative. Once age and period effects are separated out, a cohort’s trust in institutions as adults should run against the conditions of its formative years. If cohorts raised in high-trust times stay high-trust, the loop reinforces and cannot cycle. British Social Attitudes, the US General Social Survey and the European Social Survey have the cohort data for this test.
- Cohorts lead and the public follows. In the loop, the turn comes when cohorts formed on the far side of an extreme reach influence. Shifts in mood should therefore appear first in the age groups entering power and spread from there. If shifts appear across all ages at once, they are period effects, and the generational loop is not driving them.
- High and Unraveling have fixed length. In the single-delay model, every source of irregularity lengthens or shortens Awakening and Crisis and leaves High and Unraveling at one delay. Strauss and Howe’s own dates do not show this. Their Highs vary with a standard deviation of 4.6 years and their Unravelings 4.0, while their Awakenings vary least, at 3.3; only their Crises (9.0) fit the pattern. With so few turnings this is weak evidence, but it points against the simple model.
- Countries share a phase only when they share shocks. If the cycle is a national loop pushed by events, countries with different histories should drift out of phase, and come back into line only after shocks they share. If Howe is right that the saeculum is now global, unconnected societies should show matching turnings even without common shocks. Coding several countries with the same rules, by people who have not seen the Strauss-Howe dates, would test this.
None of these needs new data collection. They need people willing to state the prediction before looking at the answer.
8. The observer inside the loop
First-order cybernetics treats the system as something we watch from outside. Second-order cybernetics, developed by Heinz von Foerster and others from the late 1960s, starts from the fact that the observer is part of the system. A theory of history read by the people who make history is an example.
The sociologist Robert K. Merton described the self-fulfilling prophecy in 1948: a belief about a situation, acted on, can bring that situation about. The Fourth Turning has had readers in positions to act on it. Steve Bannon promoted the theory and built a 2010 documentary, Generation Zero, around it, and in February 2017 an opinion column in Business Insider argued that he “seems to be trying to bring about” a Fourth Turning. A forecast that a crisis is due can make people treat compromise as pointless and confrontation as inevitable. That raises the pressure on institutions, which makes the crisis look more real. It is the red reinforcing loop in Figure 3.
This part of the argument is speculative, and its effect depends on numbers nobody has measured. The hostile review added a simple version to the model, in which belief in a coming crisis grows while cohesion is below average, fades over about five years, and pushes cohesion further down. With a weak link the cycle stretched from 84 to 120 years, with the Unraveling and Crisis lengthening to 34 and 44 years. With a stronger link the reinforcing loop overwhelmed the balancing one and cohesion fell without limit. The loop can also run the other way: a forecast taken as a warning can lead people to shore up institutions early, the self-defeating prophecy that public health officials and central bankers know well. What we can say is that once a model of society is widely read, its predictions become part of the dynamics it predicts, and their effect could be large in either direction.
9. Where 2026 sits
By Howe’s own timetable we are 18 years into the Crisis and close to the window he gives for its climax. Supporters point to low institutional trust, sharp political division (in Britain the two largest parties took 57% of the vote in 2024, the lowest share since at least 1900, and in the British Social Attitudes survey published that year a record 45% said they “almost never” trust governments of any party to put the nation first), wars in Europe and the Middle East, and strained public finances. All of these are real. The model and the tests above suggest four cautions in reading them.
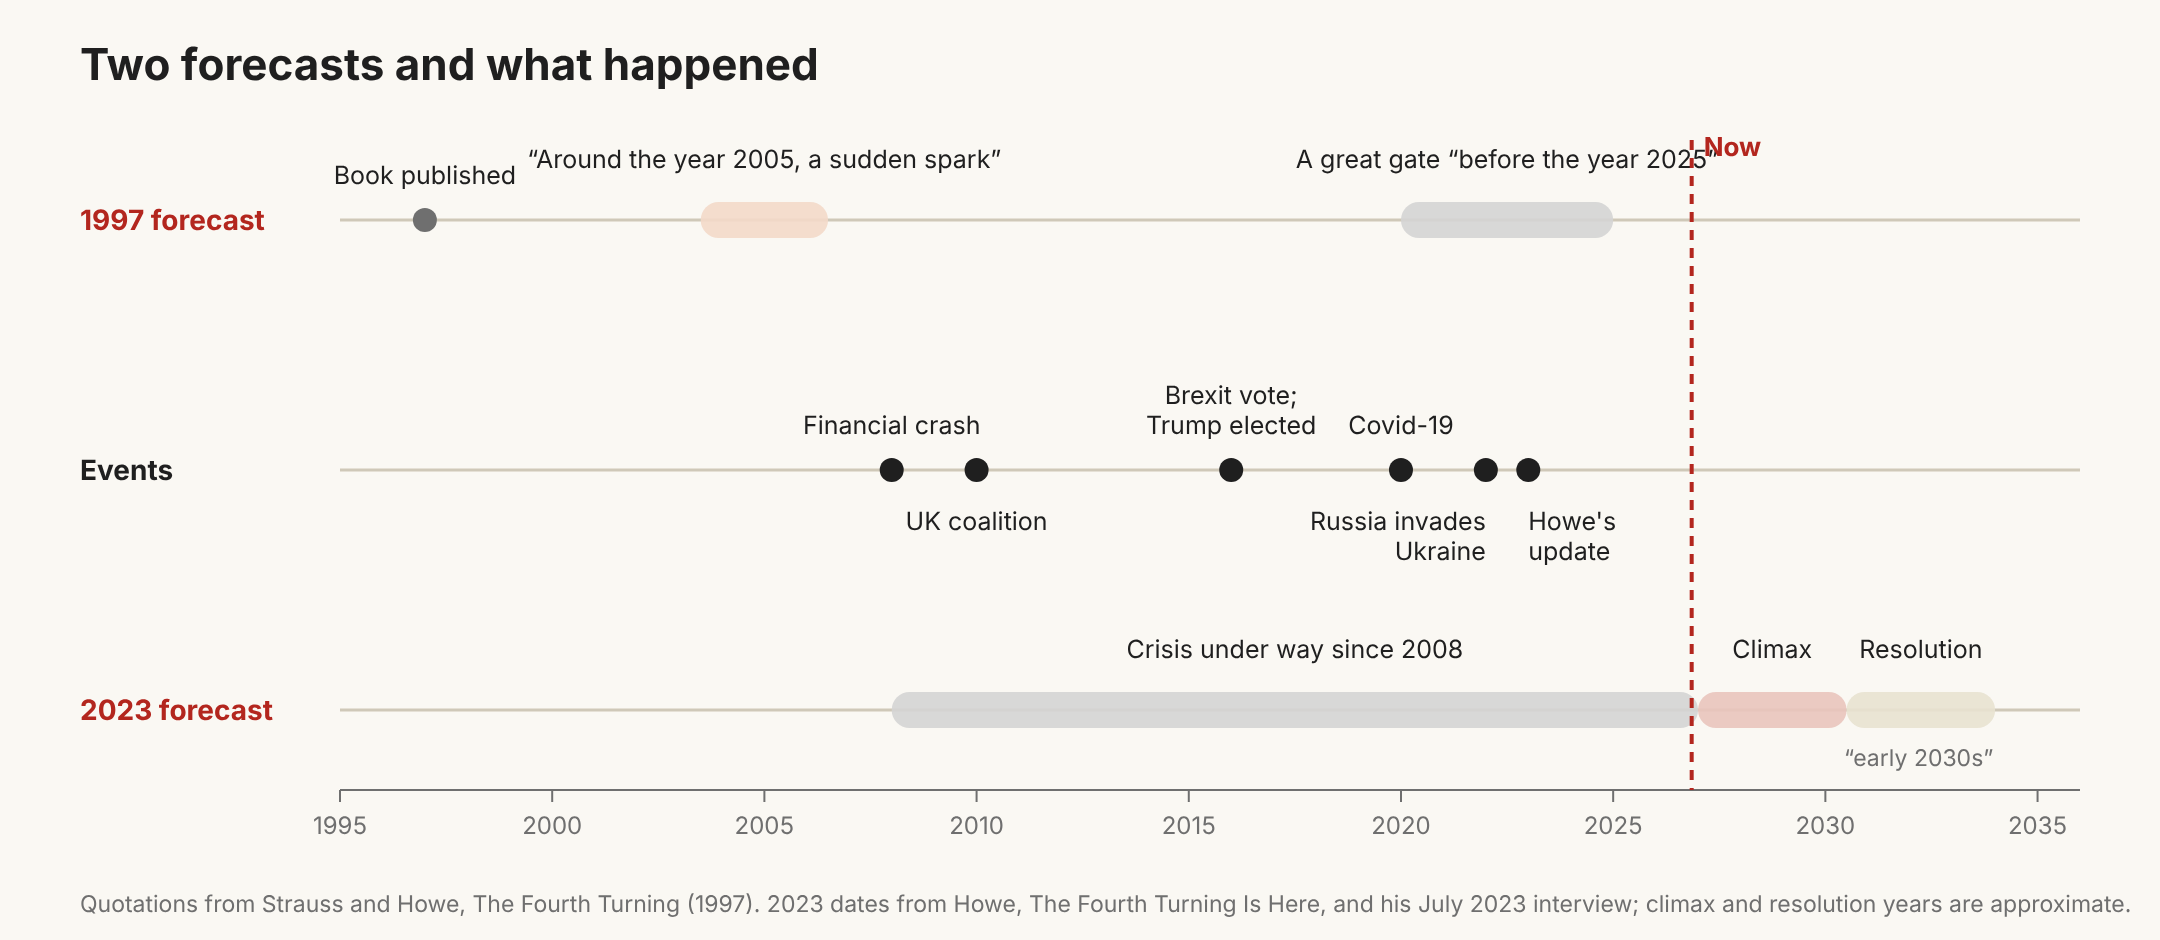
- The timetable has no support. The 1997 book said America would “pass through a great gate in history” before 2025. By 2023 Howe had moved the resolution to the early 2030s. A rhythm built from shocks would produce exactly this kind of slippage, and the measured delays in section 5.4 suggest that, if a generational loop exists, its period is longer than the saeculum.
- The present looks like a crisis on any reading. Low trust and a fragmented vote fit a Fourth Turning, and they also fit a series of shocks since 2008 with no cycle behind them. The UK test in section 6.3 could not tell these apart.
- Recovery, if it comes, depends on the sign of the loop. If generations react against their upbringing, those formed in the disorder of the 2010s and 2020s will press for rebuilding as they reach influence, over decades. If they carry their upbringing forward, as some cohort research suggests, low trust could persist. This is the question in section 5.5, and it is open.
- The theory is now an input. Many people in politics, finance and the media are watching for a Fourth Turning, and some are acting on it.
What survives, then, is small. Generational turnover is a plausible source of slow, delayed feedback in social mood. Whether that feedback balances or reinforces, how long its delay is, and whether it produces any cycle at all are open questions that existing data could answer. The 85-year saeculum and its calendar have no support from our model or from the British record.
10. Limits of this essay
Our model is a sketch. It reduces a society to a single variable and treats nations as closed systems. Its parameters were chosen to illustrate behaviour and have not been fitted to data, and the delay estimates in Table 1 use legislators as a stand-in for everyone with influence. The UK coding was done by one coder who knew the Strauss-Howe dates. We also share a wider caution raised by Pew Research Center in 2023 and by Bobby Duffy in Generations (2021): many differences that look generational turn out to be effects of age or of the period people are living through, and need to be separated before any generational loop can be measured. The model and the case study were checked in two reviews run with AI agents, one for accuracy and one deliberately hostile; the hostile review’s tests are reported in sections 5.2, 6.3 and 8. Section 7 lists the tests that would move this from an argument to a result.
Data and code
The complete code, including all the figure scripts and the tests from the hostile review with their recorded outputs, is on GitHub: Fourth Turning Feedback Model in the Neo-Cybernetics repository. The main files can also be downloaded here:
- model.py: the delayed-feedback model used for Figures 4 to 6 and 8.
- fig-spread-delay.py: the overlapping-cohorts calculation behind Figure 7.
- protocol.md: the UK coding rules and the list of dated events.
- coding.py: the UK stage coding and the Strauss-Howe dates used for comparison.
- uk_elections.csv: two-party vote share and turnout at each general election since 1900.
- uk_strikes_ons_bbfw.csv: working days lost to strikes, ONS series BBFW, 1891 onwards (Office for National Statistics, Open Government Licence).
References
- Congressional Research Service (2025). Membership of the 119th Congress: A Profile. Report R48535.
- Duffy, B. (2021). Generations: Does When You’re Born Shape Who You Are? London: Atlantic Books.
- Forrester, J. W. (1989). The System Dynamics National Model: Macrobehavior from Microstructure.
- Fukuyama, F. (2023). Review of The Fourth Turning Is Here. The New York Times Book Review.
- Ghitza, Y., Gelman, A. and Auerbach, J. (2023). The Great Society, Reagan’s revolution, and generations of presidential voting. American Journal of Political Science.
- Howe, N. (2023). Interview, The Art of Manliness podcast, episode 913, 19 July.
- Howe, N. (2023). The Fourth Turning Is Here: What the Seasons of History Tell Us about How and When This Crisis Will End. New York: Simon & Schuster.
- Kaplan, J. L. and Yorke, J. A. (1974). Ordinary differential equations which yield periodic solutions of differential delay equations. Journal of Mathematical Analysis and Applications, 48, 317–324.
- Klingberg, F. L. (1952). The historical alternation of moods in American foreign policy. World Politics, 4(2), 239–273.
- Merrill, S., Grofman, B. and Brunell, T. L. (2008). Cycles in American national electoral politics, 1854–2006: statistical evidence and an explanatory model. American Political Science Review, 102(1), 1–17.
- Merton, R. K. (1948). The self-fulfilling prophecy. The Antioch Review, 8(2), 193–210.
- Parker, K. (2023). How Pew Research Center will report on generations moving forward. Pew Research Center, 22 May.
- PoliticsHome (2024). Get to know the 2024 cohort of MPs. The House.
- Rosenblueth, A., Wiener, N. and Bigelow, J. (1943). Behavior, purpose and teleology. Philosophy of Science, 10(1), 18–24.
- Schlesinger, A. M. Jr (1986). The Cycles of American History. Boston: Houghton Mifflin.
- Slutsky, E. (1937). The summation of random causes as the source of cyclic processes. Econometrica, 5(2), 105–146 (Russian original 1927).
- Sterman, J. D. (1984). An Integrated Theory of the Economic Long Wave. MIT Sloan School, Working Paper 1563-84.
- Strauss, W. and Howe, N. (1991). Generations: The History of America’s Future, 1584 to 2069. New York: William Morrow.
- Strauss, W. and Howe, N. (1997). The Fourth Turning: An American Prophecy. New York: Broadway Books.
- Turchin, P. (2017). The prophecy of the Fourth Turning. Cliodynamica, 6 November.
- Turchin, P. (2020). Cliodynamics is not “cyclical history”. Cliodynamica, 18 September.
- von Foerster, H. (1974). Cybernetics of Cybernetics. Urbana: Biological Computer Laboratory, University of Illinois.
- Wiener, N. (1948). Cybernetics: Or Control and Communication in the Animal and the Machine. Cambridge, MA: MIT Press.
- Yule, G. U. (1927). On a method of investigating periodicities in disturbed series. Philosophical Transactions of the Royal Society A, 226, 267–298.